eHarta: Romanian maps under ‘Lambert-Cholesky’ (1916-1959) projection system
de Vasile Crăciunescu
Translation from Romanian by Codrina Maria Ilie.
Update 25.01.2011: 80 new mapsheets were added.
Update 15.09.2010: 45 new mapsheets were added.
Update 14.09.2010: 309 new mapsheets were added. We thank Bogdan Șandric (Institute for Cultural Memory) and Mihai Florea (National Museum of Romanian History) who contributed some of the new maps.
Framework: This campaign is a part of the eHarta collaborative project. For more details please visit the dedicated page.
Activity type: metadata creation.
People involved: .
Introduction
Before World War I, Romania did not have a unified cartographic system. Starting with 1916, an attempt of standardization of all the previous used coordinate systems and nomenclature systems was made in order to assure their joining. Therefore, maps in Lambert conformal conic projection, Cholensky type, were made. Shortly, mapsheets scale 1:20000 were edited and became known as "Planurile Directoare de Tragere". These were constantly update until 1959, when Gauss-Kruger projection was imposed.
The situation
From this series, we have so far been able to scan 1425 mapsheets from a total of 1700, which would cover the entire Romanian territory as we know it today. 1268 mapsheets are unique, the rest being different editions mapping the some geographical areas. Another 250 are waiting to be scanned. We wish to involve the geospatial community to document every single mapsheet. In order to do this, we have developed an interface, based on ExtJS, GeoExt, Zoomify, PHP, MySQL, which allows selection, visualization and filling up a form with required information.
The progress of the metadata creation can be seen in real time, using the map bellow.

Missing mapsheets () | Not started mapsheets () | Processing mapsheets () | Finished mapsheets ()
Making an account
Metadata creation can be made through special designed web interfaces. Only registered members can access these interfaces. One can create an account by completing a short form, available at this address:
https://www.geo-spatial.org/php/tools/register-form.php
Attention!
We respectfully ask you to complete the form using your real contact data: surname, name, email address. Accounts made by people how wish to be anonymous will not be activated.
Once submitted, your request will be shortly be attended by one of geo-spatial.org administrators and your account will be activated. After activation you will receive an automatic confirmation email. From that moment on, you can log in following this link:
https://www.geo-spatial.org/php/tools/
Using the selection interface
From the start page, follow the link "Planuri de tragere". You should see an image like this one:
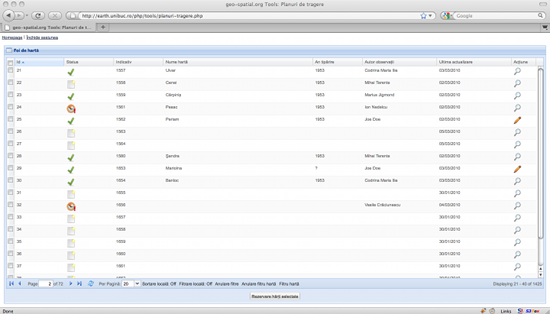
Figure 1. Selection interface.
In the table, are shown all available mapsheets. Every recording (row) has a series of eight fields (Id, Status, Mapsheet number, Map name, Printing year, Author’s observations, Last update, Action). The only field which could need some explanations is "Status". This shows, through an intuitive icon, the status of the mapsheet: Not Started, Processing, Finished. In the following, we will quickly go through all the functionalities implemented through this interface.
Navigation
For efficiency reasons, the current display shows only a subset of the total number of the mapsheets (one page). Changing from one page to another can be easily made using the buttons placed on the lower-left toolbar (first page, previous page, next page, last page). One can jump directly to a page by entering it’s number in the Page space and pressing Enter. The number of records shown on a page (by default 20) can be changed using the controller Per Page. One can chose 10,20, 35, 50 or even 100. Touching the Refresh button will update the page.
Sorting
The records table can be sorted, ascending or descending by any of the eight fields. By default, the table is sorted by the ID field. To sort the table using another field, all one has to do is to select the desired field, by clicking on it’s name. The entire table will be ascending sorted using the values from that field. To descending sort the table, all need it is to click one more time on the field. Alternatively, one can use the drop down menu, indicated in the right side of the fields name with a small arrow, when one passes over with the mouse (fig. 2). The sorting type, ascending and descending is indicated by an arrow.
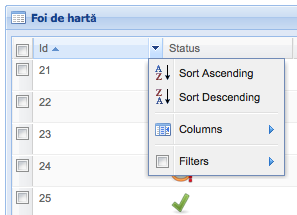
Figura 2. Table sorting.
At each sorting the application will inquire the server and will return the result applied to the entire table. If one wishes to apply the sorting only on some records shown in the current page, one must activate the Local Sorting option, placed on the lower toolbar.
Filtering
Due to the high number of recordings in the database, one of the most useful operations that can be applied to the table is filtering. In this particular case, we are dealing with two kinds of filters: with respect to attributes and with respect to spatiality. Attribute filters allow the selection of certain records based on the values registered in every field. Activation of a filter can be made through the drop down menu of each field. The attribute filters can be one of these types:
A. Numerical filter. Can be applied to the following fields: ID, Mapsheet Number, Printing Year. It allows the selection of records with a certain value (one must fill the filed with the operator “=”) or of records found under (operator "<") or above (operator ">") a certain value, or records found within certain values (interval , operators ">"&"<"). Using a numerical filter is illustrated in figure 3.
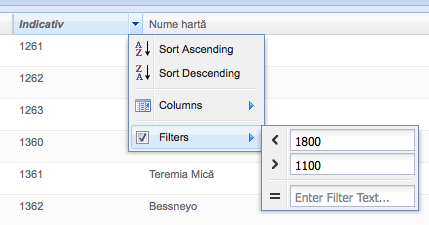
Figura 3. Numerical filtering.
B. Alphanumerical Filter. Can be applied to fields Map Name and Author’s Observations. It allows the selection of records that contain a certain alphanumeric data (Figure 4).
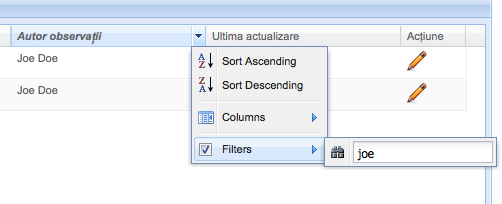
Figure 4. Alphanumerical filtering.
C. Date filter. Can be applied only to Last update filed. It allows the selection of records updated at a certain date (on), before or after a certain date (before/ after) or in a specified time interval (both options : before&after). How to use a data type filter is illustrated in Fig 5.
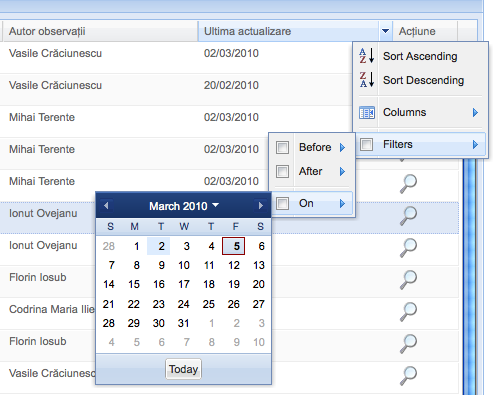
Figure 5. Date filtering.
D. Status filter. As it’s name indicates, it can be applied to the Status field. It allows the selection of records in a certain work stage : Not started, Processing, Finished (Fig. 6).
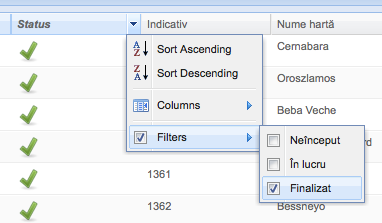
Figura 6. Status filtering.
E. Spatial filter. It allows the selection of the mapsheets, interactively on a map. To use this filter one must click on Map Filter, placed on the right side of the lower toolbar. Practically, users have an interactive map of Romania on which they can select their interest area with the mouse (drag-and-release method for the selection with a rectangle, or left click for a punctual selection). For multiple selections, one must hold down the shift key while activating the mouse. In the same manner, to change the status of one or more mapsheets, one must hold down the alt key. The current selection can be deleted using Delete selection. With the help of "+" icon from the upper right part of the map, one can change the background map (the user can chose between Google Satellite, Google Physical or OpenStreetMap). One can navigate through the map (zoom and pan) with the help of the controllers from the upper left side of the map, or the buttons on the upper right side. The confirmation of the filtering operations is done by clicking on Apply filter. Applying the spatial filter is illustrated in figure 7.
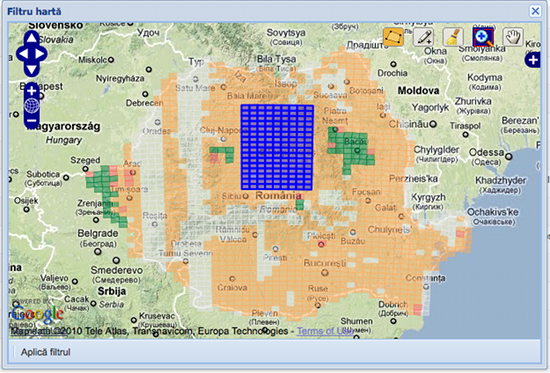
Figura 7. Spatial filtering.
The colours of the rectangles mean:
- Missing mapsheets
- Not started mapsheets
- Processing mapsheets
- Finished mapsheets
It is important to know that all these filters can be combined in order to obtain complex selections. To remove all attribute filters with one move, all one must do is click on Filter removal. In order to remove the spatial filter, one must click on Map Filter removal. Just like sorting, by default, filtering is applied to all records in the database. If one desires to apply filters only to some records from the current page, one must click on Local Filtering.
Selection (Reservation) of mapsheets
Before one can fill the metadata form for a certain mapsheet, one must reserve it. In this way, an efficient processing of mapsheets is achieved, effort duplication becomes impossible. The selection for only one mapsheet can be done by one left click on the desired record. For multiple selections, one can use the combination of Shift+ left click or Ctrl + left click. The next step is to click on the Reserve selected mapsheets, placed at the end of the page. Immediately after this, the filed that indicates the status of a mapsheet will change from Not started to Processing and the button Action will change from Preview to Editing.
Attention!
Only records with Not started status can be reserved. One user can not have at a given moment only 20 mapsheets reserved, with the status Processing
Use of the metadata creation interface
Through clicking on the Editing a new window with two distinct areas opens (Figure 8):
- left: the form where the metadata will be introduced
- right: the application for interactively visualizing the map
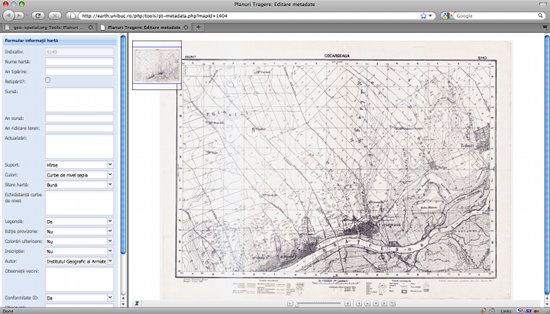
Figura 8. Interface for metadata creation.
The idea is simple. Using the functions for map interaction (zoom, pan) one identifies information on the map and then completes the form with the requested ones. The form’s fields will be filled in as follows:
Map name. The name of the map, as it is written in the upper central part of upper-left part of the map (Figure 9 -10). The use of diacritics is compulsory. The name will be written using title case. Therefore, a name written on the map as "MĂXIENII DE JOS" will be written in the form "Măxienii de Jos".

Figura 9. Example: name placed on the upper central part of the map.
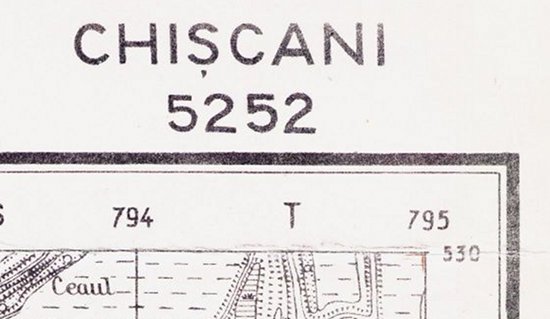
Figura 10. Example:name placed on the upper left part of the map.
Printing year. The year the map has been printed. Most of the times, it will appear in the lower left corner of the map, next to the institution that made the map (Fig. 11).
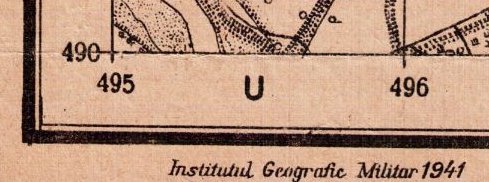
Figura 11. Example: printing year.
Republished?. It will be marked only if next to the printing year appears the word "reprinted" (Figure 12). This indicates that the map is an older edition, reprinted.

Figura 12. Example: reprinted.
Source. The sources used in making the map, such as other maps, topographic surveying, when these are mentioned. (Fig. 13-15).

Figura 13. Example: source.

Figura 14. Example: source.

Figura 15. Example: source.
Year map source. The year when the map used as a source for the documented map had been made.
Survey year. The year of the topographical survey that stood at that basis for the current map. If the survey had been made during several years, these will all be noted, separated by comma. In the case presented in figure 16, the form’s field will be filled in with the following (no quotation marks) "1900,1902,1904". Even though, on the map the year is shortened, the user will write the complete number (Figure 17).

Figura 16. Example: topographic survey year.

Figura 17. Example: topographic survey year.
Updates. Will be completed with possible mentions regarding the map’s updating. Usually, these are written in the lower right corner of the map (Figure 18). There are situations, as well, when this information can be found in the left lower corner (Figure 19).

Figura 18. Example: Updates

Figura 19. Example: Updates.
Canvas. The map’s canvas (paper or linen). Most of the maps are printed on paper. There are some, though printed on paper and placed on a linen support (these were maps meant to be used on the field, where folding and unfolding would often occur). These are easy identifiable, due to the discontinuities areas (Figure. 20)
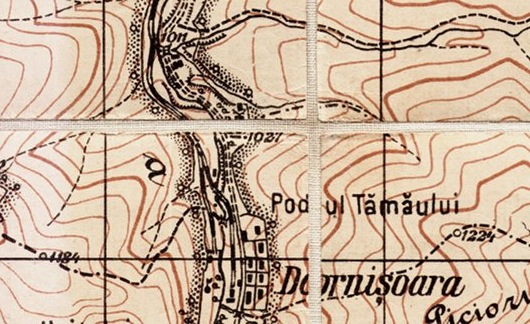
Figura 20. Example of map on a linen canvas.
Colours. Colours used at printing. Most of the maps are black and white (Figure 21). On some, colour brown was used for relief and black for the rest of the representations (Figure 21). On a few, a third colour appears : green for vegetation. (Figure 22).
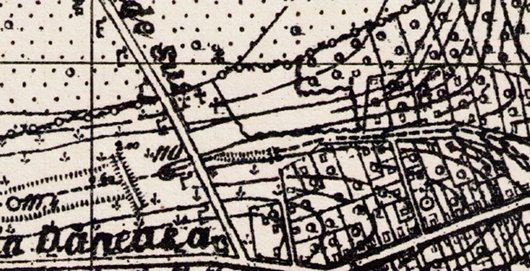
Figura 21. Example: Map coloured in only in black.
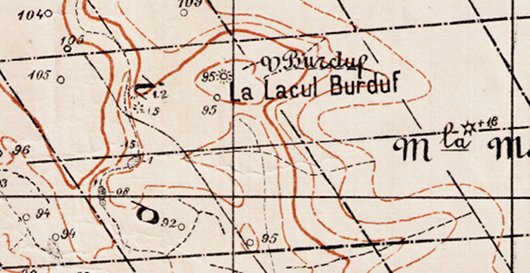
Figura 22. Example: Map coloured with brown for relief and black for other elements.
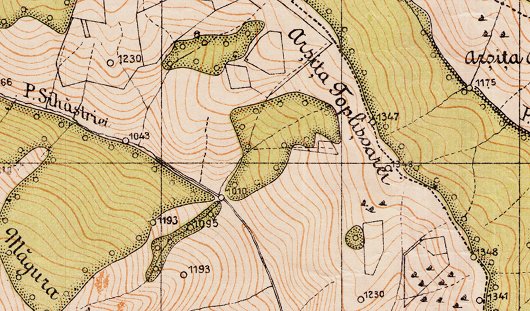
Figura 23. Example: Map coloured with black, brown and green.
Map condition. Qualitative appreciation of the maps condition. One would select satisfying when the map has small breaks or foldings. The bigger and more important for the map’s quality are the foldings and breaks, the lower the qualification will be given.
Distance between contour lines. Distance between contour lines on the map will be coded. One could encounter more than one situation, in relation with the way that equidistance are shown on the map. The easiest case is shown in figure. 24. In the text cassette below the imagine, it is presented the way the filed in the metadata form will be filled in.

Figura 24. Figure 24. Example: simple case of distance between contour lines.
p:20
Figure 25 shows a situation somewhat more complex. The way to code the information is presented in the cassette below the imagine.
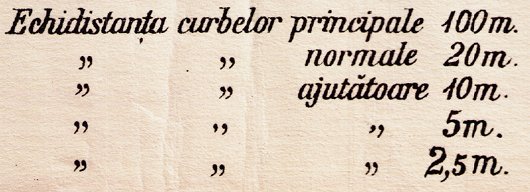
Figura 25. Example: complex case of contour lines distance.
	p:100
	n:20
	a:10,5,2.5
There are situations when the distance between the contour lines differ in the same mapsheet. The most common case is when the map covers a transborder region. This is the case shown in figure 26. In the metadata form, only values for the Romanian territory are specified, and the complete text regarding the situation in the Bulgarian territory will be mentioned in the Observation field.

Figura 26. Exemplu: caz transfrontalier echidistanță curbe de nivel.
	p:50
	n:10
	a:5,2.5,1.25
Another case, seldom seen, but shown in figure 27, is to have the same situation presented above, but in a mapsheet that covers completely only Romanian territory. The way to interpret these situations is illustrated in the text cassette below the imagine. In the Observations field will be mentioned that the distance between the contour lines is not the same for the entire mapsheet.

Figura 27. Example: particular case of distance between contour lines.
	p:100
	n:20
	a:10
	p1:100
	n1:10
	a1:5,2.5,1.2
Attention!
Between the separators used in this field there will not be any spaces.
Legend. It will be mentioned if the mapsheet includes or not a legend with conventional signs used to represent the elements on the map. When it does, the legend is placed in the central lower part of the map (figure 28).

Figura 28. Exemplu: legendă.
Provisory edition. Will be mentioned if the mapsheet is or not a provisory edition. Maps that have this status are marked with the text “Provisory edition”, usually placed in the lower left side (figure 29).
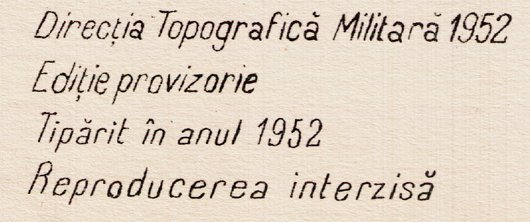
Figura 29. Example: Provisory edition.
Later-added coloring. It will be mentioned if the mapsheet has been colored after printing due to updating (Figure 30) or embellishing purposes (Figure 31).
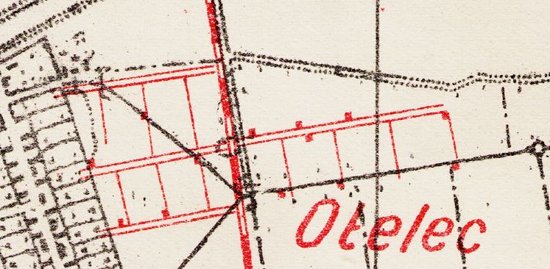
Figura 30. Example: Later-added colour.
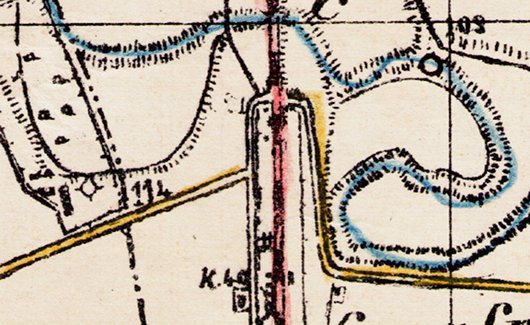
Figura 31. Example: Later-added colour.
Inscription. It will be stated if the map has or not in the upper central part the inscription: “Planul Director de Tragere”.
Author. The institution that made the map will be selected.
Neighbour related observations. In the case of transborder maps, information regarding sources used for representing the territory of the neighboring country will be mentioned (Figure 32).

Figura 32. Example: Neighbour related observations.
ID accordance. It will be verified if the mapsheet number, written in the first line of the form is identical with the one written on the map.
Observations. A field where any other additional observations or notes on the mapsheets can be recorded (Figures 33-35).

Figura 33. Example: Map inscription.

Figura 34. Example: Alternative/updated name.
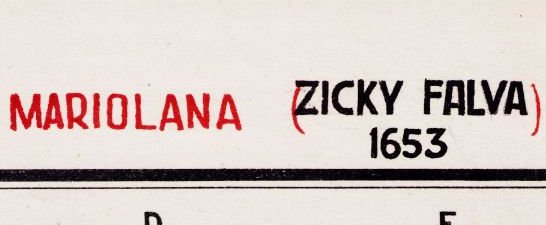
Figura 35. Example: Updated name.
Attention!
Fields for which the map has no information will not be filled in.
For any query or suggestion, you can contact us through our discussion list.
Known issues
- Under Internet Explorer 8, the map within the metadata creation interface is not shown on the entire display.We recommend the use of an alternative browser (E.g. Firefox, Safari, Opera, Camino)
- The application is not functional under Internet Explorer 6.
- Sometimes, in the editing interface, the values in the predefined-options fields are not shown completely (one can see just some numbers). It’s suffice to click that field (drop-down menu) for the values to be correctly shown
